Description of Project
With the levels of complexity surrounding this project, there are several things I feel like I have to address concerning my data sources, findings, and dashboard.
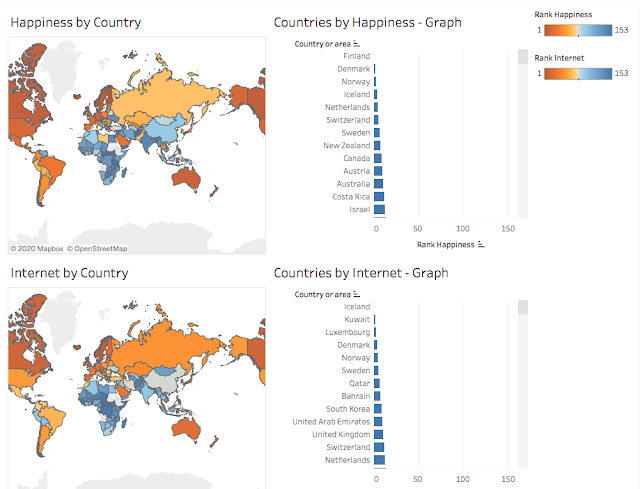
First and foremost, international data collection is a difficult process even for huge organizations. In several countries it is difficult to collect data due to several reasons ranging from conflicts to political restrictions to low response rates (https://www.researchgate.net/publication/293425480_Challenges_of_data_collection_in_developing_countries_-_The_Pakistani_experience_as_a_way_forward). For example the African country Western Sahara is often not included in data collections, and the country is caught in a politically driven conflict with neighboring countries. Thus only 153 countries are represented in my findings, as I only could find sustainable data for these countries. Some countries where represented on the happiness index but not on the internet usage index, and vice versa. The small island nations in Oceania are especially a 'great' example of my point, as I was lacking a measurement to do the comparison for almost all of them.
Now being a part of the first generation 'raised online', I've always thought that spending a lot of time online must have negative consequences. Seeing people stuck to a screen really makes me think 'oh wow that person is truly missing out on life', and it would make me angry to see people stuck to their phone during hangouts. A research conducted in 2019 shows that the average person spends 3 hours and 45 minutes on the internet daily (https://www.statista.com/statistics/416850/average-duration-of-internet-use-age-device/), that's almost four hours one could spend on actual human interaction or at least something more productive - right? I'm sure a lot of people thinks the same way as me, and I'm speaking from experience as well - when I decide to spend my time with friends rather than online I am much more happier! What I found so interesting with doing this project was that I got to challenge my own views and learn something new, and actually surprise myself! Perhaps you feel the same way after seeing the results from my Tableau story?
Are there any truth to this illustration? That's what I wanted to find an answer to in my project.
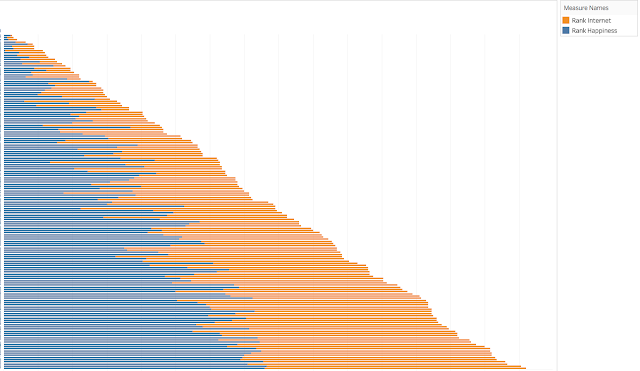
After conducting my project I was surprised by my findings and dashboard because they showed me something I really didn't expect. In Africa the countries ranked similar in happiness and internet usage, which was surprising. In the American continents and in Oceania the countries ranked lower in internet usage, which essentially is the only results supporting my thesis. It was a combination of doing 50-50 and scoring better in one measurement in both Asia and Europe. How interesting is this? I really though my thesis was so strong and was certain I would see results that I expected, however my thesis is barely an exception based on my research. Even Europe, which is the continent I would expect to show the most accurate results (due to lack of severe internal conflicts) did not support my thesis.
(https://www.bloomberg.com/opinion/articles/2019-02-25/yes-the-internet-can-make-us-happier)
In the end I have to admit defeat. My thesis was proven wrong, but I'm sure I'm not the only one surprised my the results. So going forward I would love to see us as a society work towards finding other reasons for poor mental health and combat it because high internet use might not be as bad as we have thought it to be.
Mia Moen
Berkeley College '21


Comments
Post a Comment